
Earth Observatory
Earth’s City Lights
The Defense Meteorological Satellite Program (DMSP) Operational Linescan System (OLS), an instrument that uses visual and infrared imagery to monitor cloud top temperatures and the distribution of clouds over Earth, captured this image of Earth’s electrically generated lights. This map of the Earth’s city lights immediately captivated my interest due to how the illuminated metropolitan areas across the globe are recorded by the thermally emitted heat of the electric light, instead of direct daytime sunlight. The darker areas, such as the vegetative jungles in South America and Africa, show the lack of urbanization even though the discovery of electric light is more than 100 years old. The map displays bright, concentrated areas of light, which is useful tool in determining the location of highly urbanized areas on various continents. However, even though concentrated areas of light directly relates to the level of urbanization of a region, it does not correspond to the population of such areas. For example, China is less bright than the United States even though the population of China is 1,324,655,000 compared to the United States with a population of 307,006,550. The image visually displays the tendency of populations to cluster near coastlines and well-established transportations systems as opposed to the often resource deficient deserts and the inhabitable, strenuous arctic regions.

NatGeo News Watch
Map of Critical Habitat: Kauai
National Geographics News Watch was the original source of this map displaying the currently determined critical habitat of endangered species, as well as the newly proposed critical habitat. This map does not display regional names or grids like more commonly known maps, but this map does show the designated regions occupied by endangered species. The proposition to include the highlighted purple regions signifies the effort to include habitat of species being threatened by external sources. This map is especially intriguing because I was surprised to see such a small amount of the land on the Hawaiian island, Kauai, to be excluded for endangered species protection purposes. The proposed critical habitat seems to look like a large region on such a small island, but it may be necessary if the endangered species list continues to grow as quickly as its current rate.
Snow-Forecast.com
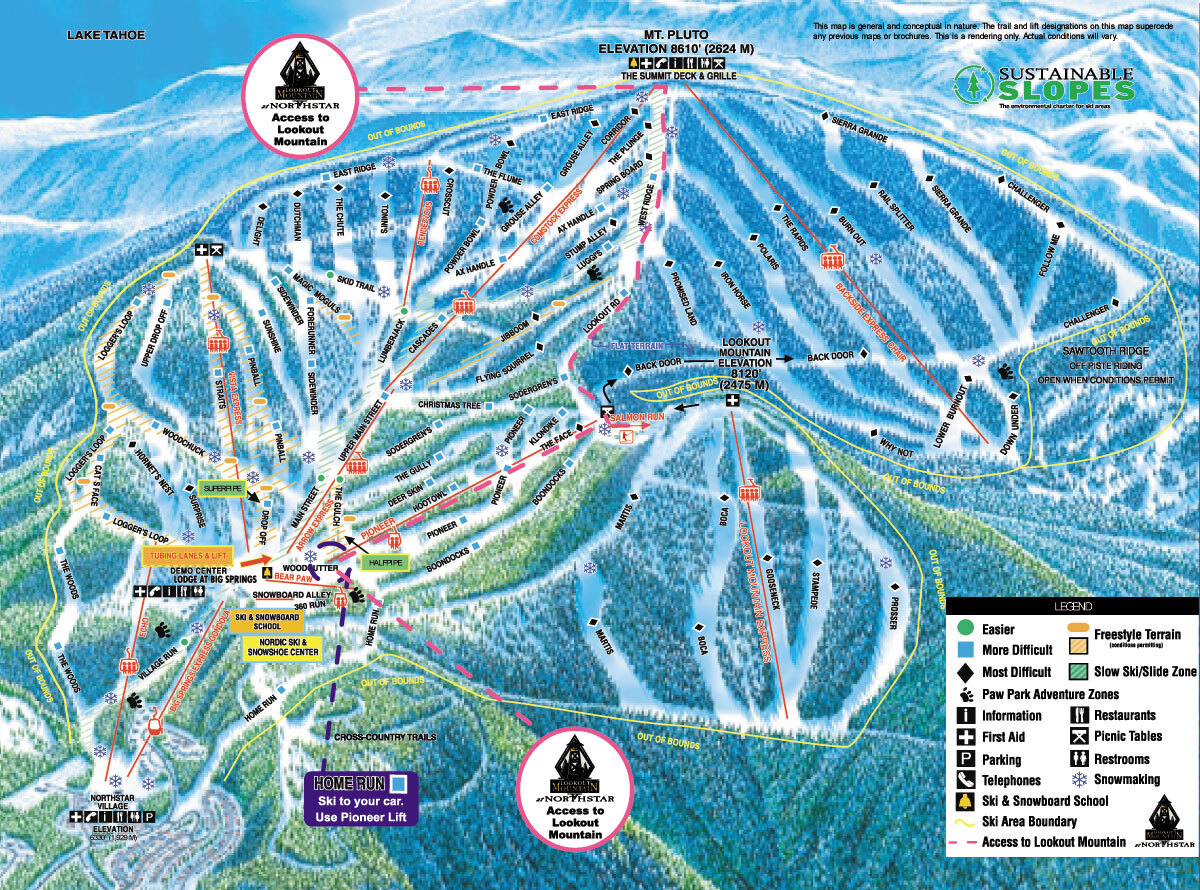
Northstar Ski Resort at Tahoe, CA: Interactive Trail Map
The dependable site for many skiers and snowboarders, snow-forcast.com, is the webpage source of the Northstar Ski Resort map, but the map’s origin was established by Northstar’s homepage. This “Interactive Trail Map” highlights the individual mountain, Mt. Pluto, designated for ski resort guests as well as the public (paid admissions). The terrain varies on Mt. Pluto, and is divided into scaling levels of difficulty, which makes it easier for guests to decide the runs they wish to try based on their personal skiing or snowboarding skill level. The map also names the available resort necessities, such as food, bathrooms, first aid, and the specific location of each accommodation on Mt. Pluto. The main reason as to why I find this map interesting is because it is a truly essential tool while on the mountain any given day. My family has been skiing at Northstar for many years, but I still carry a map of the mountain on me at all times. Without such a map of the mountain, it is almost too easy to find yourself lost on the backside of Mt. Pluto, attempting to ski or snowboard a terrain, which may be far beyond your desired difficulty level. Luckily, the map provides such detailed analysis of each ski run that it makes the experience for each skier or snowboarder less intimidating and more enjoyable.